
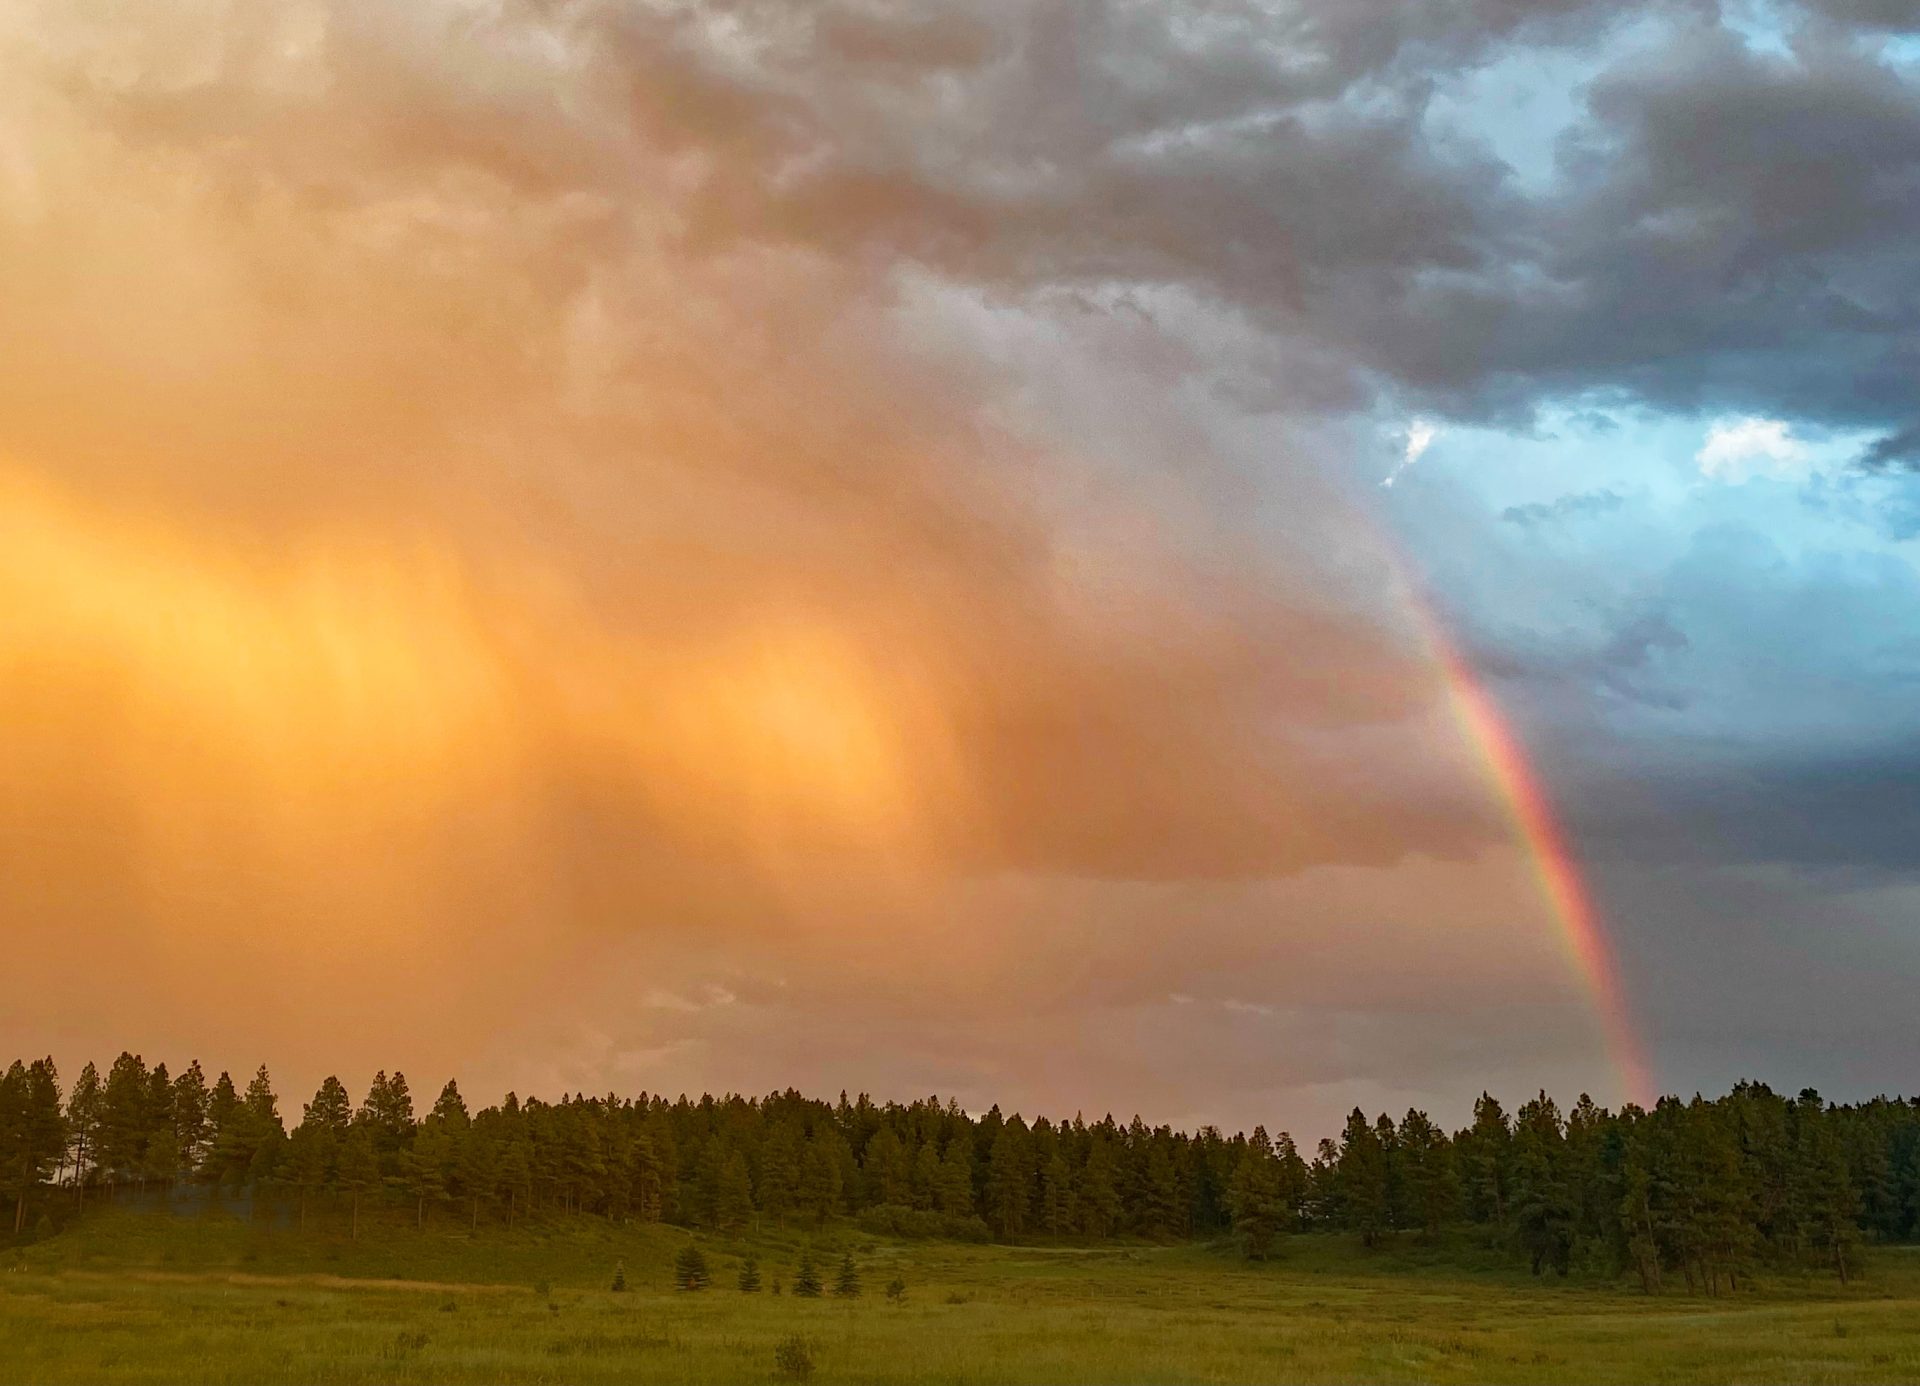
An evening monsoon shower over the Turkey Springs area – Pic taken 7/24/2024.
Sunday – 4 May 2025 – 7:00pm
“The monsoon teaches us that even the sky cries, but it also brings life.” Author Unknown
Last summer Tropical Storm Alberto came to visit in the middle of June. All that tropical moisture, remained in the southwest being recycled for a few weeks. We ended up with 8.27″ of precipitation during our normal monsoon season of July, August, and September. That is two inches more than the average of 6.25″ precipitation during our average monsoon.
However, the La Nina ENSO pattern set up for the winter months. This left us on the south side of all the good snow action that was taking place to the north. After such an abysmal winter, with one of our lowest historical snow packs, we need a good, wet monsoon.
The average monthly precipitation in July in Pagosa Springs doubles from what we see in June of .93″ to 2.01”. This is due to the North American Monsoon that impacts the southwest region from early July till the end of September. Some years it begins earlier and other years it lasts longer. In a few notable years it has lasted much longer when we have an active Pacific tropical storm season and tropical moisture is caught up in the southwest flow as the monsoon weakens in September and October.
August is our wettest month of the year with an average of 2.69” of precip. Since the monsoon tends to weaken in September due to temps in the upper levels cooling and the subtropical ridge weakening, the average precip for September drops to 1.85”.
A review of Earth Science to understand the Monsoon
Let’s review a little basic earth science before we discuss what we can expect for a monsoon this year. If you believe the earth is flat, you’re not going to like the first earth science fact. The earth is round! Technically it is an oblate spheroid.
As the earth spins, Coriolis, Centrifugal, Centripetal, and Pressure Gradient Forces tug and pull at each other to give us our six primary circulation zones. We live under the northern Ferrel Cell and have westerly winds. If the earth were uniform, our winds would be nice and steady out of the west, and we wouldn’t have much to report to you each day.

The Earth’s Airmasses
However, the earth is broken up by massive areas of ocean and land. These areas cool and heat differently. Ocean areas are slower to warm and cool. Weather airmasses form over the ocean or large land areas that have homogeneous temperature and humidity stretching over hundreds to thousands of square miles.
Note: The San Juan Mountains are NOT an airmass source region due to the rugged topography.
A Continental Polar airmass forms over the high plains of Canada, a Continental Tropical airmass forms over the desert southwest and, most important to our discussion, Maritime Tropical airmasses form over the Gulf of Mexico and the Baja area.

These airmasses migrate from their original location due to the circulation zones and oscillations. When they interact with other airmasses, the fun begins! Areas of low pressure and fronts form, and weather happens!

Throughout the year these airmasses strengthen and weaken. For example, the lack of sun during the winter strengthens the Canadian Polar airmass which is dry and cold. And during the summer, the long days and strong solar radiation strengthens the Gulf Maritime Tropical airmass which is warm and moist.
The warm and moist Maritime Tropical airmass interacting with the hot and dry Continental Tropical airmasses are important pieces of the North American Monsoon.
What is the monsoon?
“The term monsoon describes large-scale wind shifts that transport moist tropical air to dry desert locations, such as the southwestern United States. A monsoon pattern also affects several other locations around the world including Southeast Asia, Australia, Africa, and South America. The Indian Monsoon is the strongest in the world due to the height of the Tibetan Plateau.”
As the earth tips towards the sun, North America warms, the polar front jet and associated pressure systems and fronts move north and weaken. At the same time in southern Colorado, the upper-level winds switch from the west to the east and the area falls under the influence the Hadley cell for about three months.

Lifecycle of the North American Monsoon
Early Monsoon Sputters: Typically, late June through mid-July there will be sputters of the monsoon as the pattern tries to ramp up. This early monsoon is characterized by high based, dry thunderstorms. Since May and June are typically our dry season and fuels will be dry. These early thunderstorms with lightening but little rain can touch off wildfires.
Peak Monsoon: If the pattern can set up properly by mid-July and hold strong, we should see monsoonal showers about every day through mid-August.
Late Monsoon: We tip away from the sun and areas supporting the ridge start to cool. The ridge weakens and so does the easterly flow. So, we’re back to the sputter and start events towards the end of August through the beginning of September.
As we get into September, the Pacific waters are warm enough for tropical storms to really intensify. A Pacific tropical system can feed into our monsoonal flow and then the good times really take off with potential for widespread heavy rains and localized flooding. These Baja area storms can last well into the night.
Note: It takes longer for Pacific storms to get going compared to the Atlantic due to how deep the Pacific is and that the east Pacific is cooled by northerly ocean currents whereas the Atlantic is warmed by southerly currents.

Ingredients for the North American Monsoon
1. Intense Heating
“Intense heating of the land over Mexico and the southwestern United States in the early summer months creates the wind shifts in the low levels.” This chart from last year shows afternoon high temperatures warming up by the 2nd of June to over 100 degrees Fahrenheit.
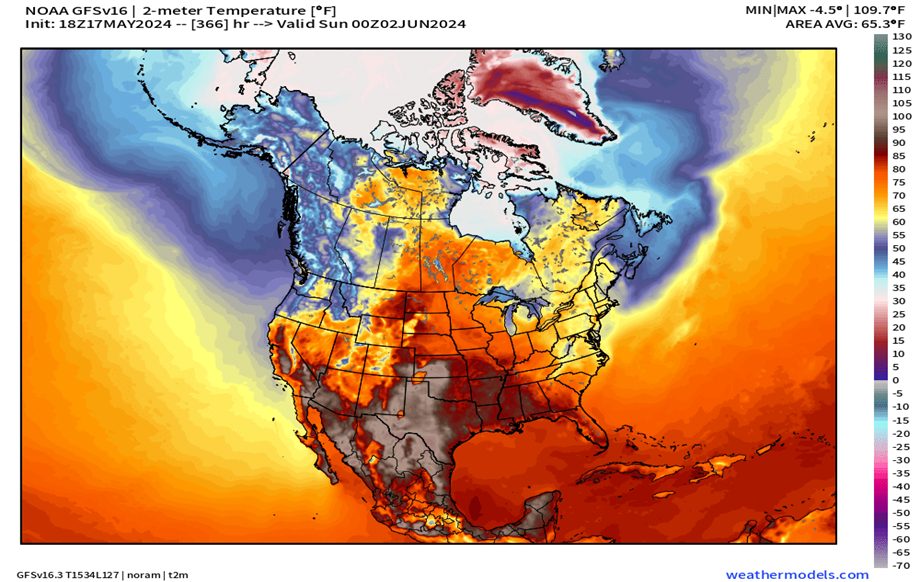
Note: Model data are algorithms based on current data from observations and satellite data built into a grid and run through a supercomputer. See this link for a more in depth explanation. https://pagosaweather.org/weather-101/what-are-weather-models/
The farther the model forecasts into the future the less reliable it is as depicted in the graphic below. Based on this a one month to four-month forecast is going to look like a squiggle. But it is a great place to start!

2. Strong 500 millibar (mb) ridge
500MB averages 18,000 feet in a standard atmosphere. Meteorologists like to look at this level to determine where the atmospheric highs and lows are (the surface can be deceiving). The larger the height, the warmer that column of air is. It’s a great tool! We use the term “ridge” for a bubble of warm air. Another description is a High in the upper levels with anticyclonic or clockwise turning.
To be a strong ridge, it should be at least 595 decameters. This chart is is from July 2021 when we had a nice strong ridge of 594+ that had built over the southern plains into the midwest.

3. Position of the Ridge
Position of the ridge is important too. We want it to stay to our east, positioned from the southern plains to the four corners.
If it drifts to our west, over Arizona and Utah, our moisture is cut off and the atmosphere is more stable. That is exactly what happened in 2021 but southern Arizona had the 3rd wettest monsoon on record! But the ridge was too far west for Archuleta County. We saw some afternoon showers but it was from moisture wrapping up and over the ridge and approaching us from the northwest rather than the southwest. In that case we get lee side affect rather than orthographic lift.
Below are a few studies from the Albuquerque NWS office. In August, 2006 the ridge was centered over the southern plains. For the month, the Archuleta country area had 3 to 8” of rain.

As compared to July 2008 when the ridge was centered over the four corners area and we had 1 to 3” of rain.

4. High Surface Dew Points
Next, we can look at the surface dew points across Arizona to see if moisture is slowly moving into our area to provide fuel for those afternoon thunderstorms. Moisture can wrap from the Gulf towards the northwest and into the desert southwest or it can also move northeasterly out of the Baja area. At the peak of the monsoon we want to see dew points of 50 degrees and above.
Below are charts showing the dew points at several locations to our south in the summer of 2021. The red lines indicate the average for those dates. The blue line is the current years dew point. As you can see, all locations were fairly dry in June and saw an uptick into July. We look closely at the steering flow to determine which site to track.

So those are the ingredients for the North American Monsoon. What evidence can we examine to determine the monsoon season outlook?
Clues for the North American Monsoon Season Forecast over Pagosa Springs
There are several parameters we can examine to determine what sort of monsoon season we will have.
1. Correlation to Arctic Oscillation (AO)
When the AO is in its positive phase, a ring of strong winds circulating around the North Pole acts to confine colder air across polar regions. This belt of winds becomes weaker and more distorted in the negative phase of the AO, which allows an easier southward penetration of colder, arctic airmasses and increased storminess into the mid-latitudes.
In the graph below, you can see the AO has been neutral to positive since mid February with weak outbreaks from time to time. Those weak outbreaks can be connected to the cut off lows that have formed in the Pacific over the last few months.
For the purpose of a strong monsoon pattern, we want the AO to stay positive with the stronger winds staying north rather than slipping south into the mid-latitudes. This can interrupt the building of our sub-tropical ridge. This is not a concern till July.

2. Tropical Cyclone Activity
Over oceanic areas, the way in which systems and air masses circulate is referred to as oscillation. In the central Pacific, the primary oscillation system is the Walker Circulation. This system assists moving pressure systems, associated fronts, and air masses along so that we are impacted by weather systems and receive precip on a regular basis. However, differing sea temperatures can throw this schedule off.
A common query I have received lately is, “Looks like we’re going to be La Nada this summer. How does that impact our monsoon?”
In order to answer that question, we have to look at what has been happening with and at the current El Niño-Southern Oscillation (ENSO) forecast.
First, what is the ENSO? According to the National Oceanic and Atmospheric Administration (NOAA), “El Niño and La Niña are the warm and cool phases of a recurring climate pattern across the tropical Pacific ENSO. The pattern shifts back and forth irregularly every two to seven years, and each phase triggers predictable disruptions of temperature, precipitation. These changes disrupt the large-scale air movements in the tropics, triggering a cascade of global side effects.”
The Sea Surface Temperatures are measured across the Pacific near the equator. They have found a correlation between North American effects and area 3.4 in the middle of the Pacific.


The sea surface temperatures in the central Pacific have been neutral since February. The forecast is for the temperature to remain neutral or La Nada (within a 1/2 degree of average) for the rest of the summer.
During La Nada the waters in the Pacific do not have areas that are being enhanced or suppressed. This makes it harder to forecast and to track the systems that do develop. It results in a weaker subtropical jet.
This weaker subtropical jet creates less shear across the Atlantic and the Pacific which can enhance formation of tropical storms and hurricanes. Shear from a strong jet is a breaking mechanism. At the same time, the warm waters are favorable for storm formation and the waters will be warmer in the Atlantic.
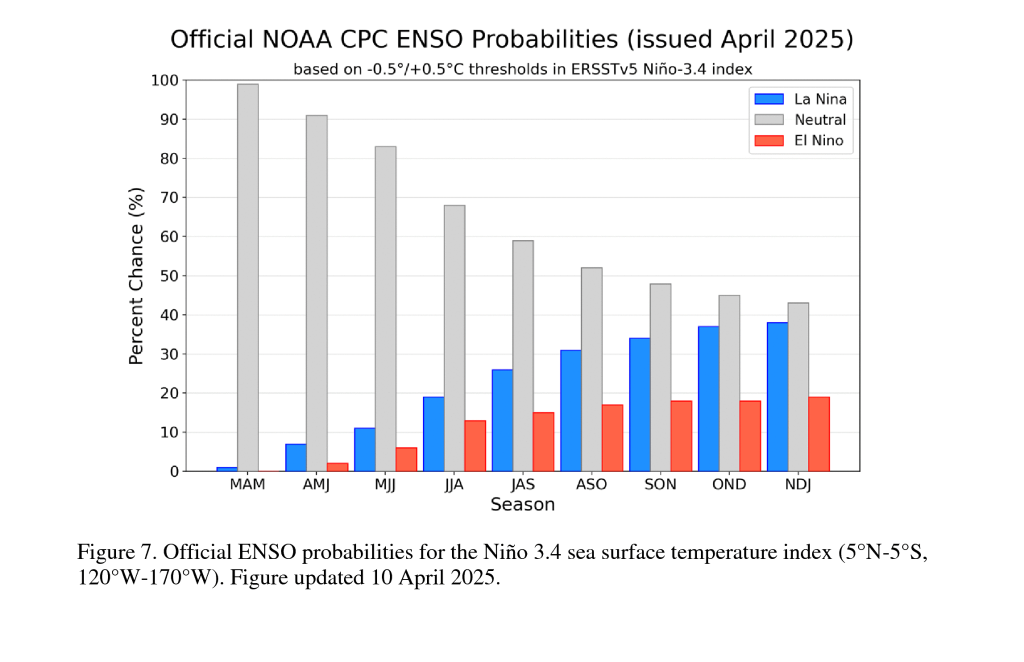
The official NOAA’s outlook for the 2025 Atlantic and Pacific season is not out yet. I’ll update this post when it becomes available. I’ll include an updated ENSO forecast.
We know that the first named storm will be Andrea. We hope she sneaks in and her residual moisture visits us similar to Alberta to last year. We sent her a gold embossed invitation to visit Pagosa Springs!
Colorado State University has issued their tropical storm forecast for the Atlantic. Unfortunately, they don’t do a forecast for the Pacific.
“We anticipate that the 2025 Atlantic basin hurricane season will have above-normal activity… there remains considerable uncertainty as to what the phase of ENSO will be this summer and fall. Sea surface temperatures across the eastern and central Atlantic are generally warmer than normal, but not as warm as they were last year at this time. A warmer-than-normal tropical Atlantic combined with likely ENSO neutral (or potential La Niña) conditions typically provides a more conducive dynamic and thermodynamic environment for hurricane formation and intensification.”
3. Low Snowpack/Above average Monsoon Correlation
The Tucson and the Albuquerque National Weather Service Offices have done studies where they have found, “A significant correlation exists in the observed data such that wet winters in the Southwest are generally followed by dry monsoons, and dry winters are generally followed by wet monsoons.”
The logic is that with a shallow snowpack deep warm temperatures set up earlier in the season. Those warm temperatures help turn the winds to the east to facilitate the formation of the monsoon.
Here is southwest Colorado, our snowpack is at just 27% of normal. Areas in New Mexico are at an abysmal 0%… Based on their study, we should have an above average monsoon.

I was curious as to whether there was a correlation to our snowpack and to our monsoon moisture so I looked a back at the last twelve years of data for snowpack in April and in May as compared to the summer monsoon. I also looked at southern Arizona’s snowpack. The inference is that with a low snowpack, the surface temperatures will start heating sooner and the ridge will start building sooner leading to any early onset monsoon season.
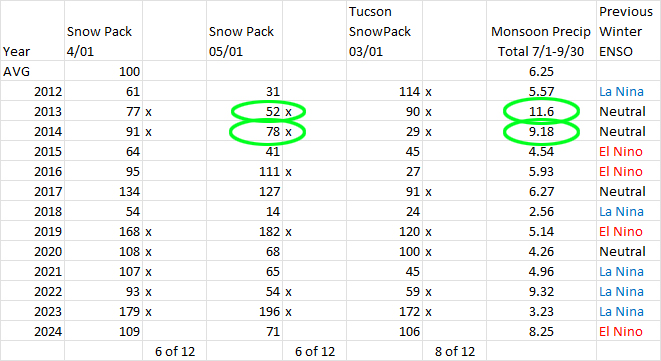
Unfortunately, based on the data I analyzed, I could not find a true correlation for Pagosa Springs. I thought I would still share the data with you. Another possibility is that it might be that 12 years is not large enough of a sample size. This is something I will continue to study and track.

Note: 2018 was the worst year in recent history with 14% snow pack by May 1st. And we only had 2.56″ of precip for the monsoon. It was also a La Nina year. However, the ridge set up too far to the west and left us high and dry under northwest flow.
Official Monsoon Season Outlooks
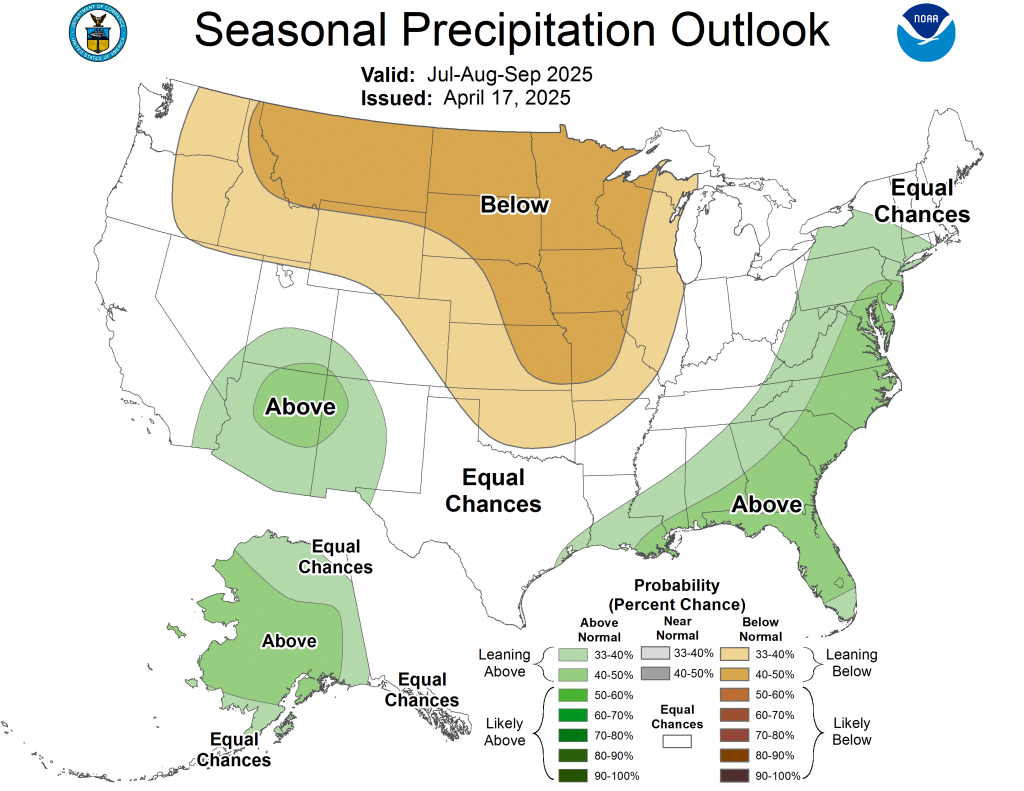
First, the National Weather Service Climate Prediction Center three-month precip forecast shows that the monsoon would be slightly above average for July, August, and September for southwest Colorado.
Keep our horse graphic in mind.
The GFS model is interesting because it shows a lot of detail indicating it is a higher resolution model with perhaps better terrain built in compared to the other models for its seasonal outlooks. It shows above average precipitation in the Pagosa Springs and San Juan mountain areas.
This model verified well last summer.

The Euro Model seasonal forecast is also showing above average precipitation for southwest Colorado for the months of July, August, and September.
The Euro did not verify well last summer. It had shown less than average precipitation across the entire area.

The Canadian seasonal forecast is expecting ABOVE average precipitation for southwest Colorado for the months of July, August, and September. It is showing the highest probability. It verified well last summer, too.

Pagosa Weather’s Monsoon Forecast
The Pagosa Weather Forecast for the ’25 Monsoon season:
– The ridge has been to our south all winter and is what kept our winter pattern from setting up. Based on low snowpack that same subtropical ridge should set up early. As a result we should see an early onset of the monsoon in late June.
– July and August should have average to above precipitation. Remember, we have to keep an eye on it and make sure it does not drift too far west.
– September should have at least average precipitation. The temperatures cool and the ridge weakens as we tip away from the sun. We really need to see how the ENSO is going to set up as we start going into the fall months. At this time it is not clear. In addition, the Eastern Pacific tropical storm forecast is not out yet. If we can see the remnants of a few of those storms moving in from the Baja area that can really influence our overall precipitation amounts as we move into fall. I’ll add that forecast when I update this forecast around the 1st of June.
The Pagosa Weather Monsoon forecsat is that we will have an above average monsoon overall.
If you would like to read more about the subjects I have discussed, I have included some links for your reading pleasure.
2021 Tucson, Arizona Monsoon Review
Review of the 2022 Monsoon Across the Southwest U.S.
Review of 2023 Monsoon Season in New Mexico
NWS Albuquerque Monsoon Highlight
Arleen Prochazka


One Response
I love a good SW monsoon season! Hoping for a great one with lots of rainbows 🙂