Pagosa Weather JUNE SUMMARY & July Outlook

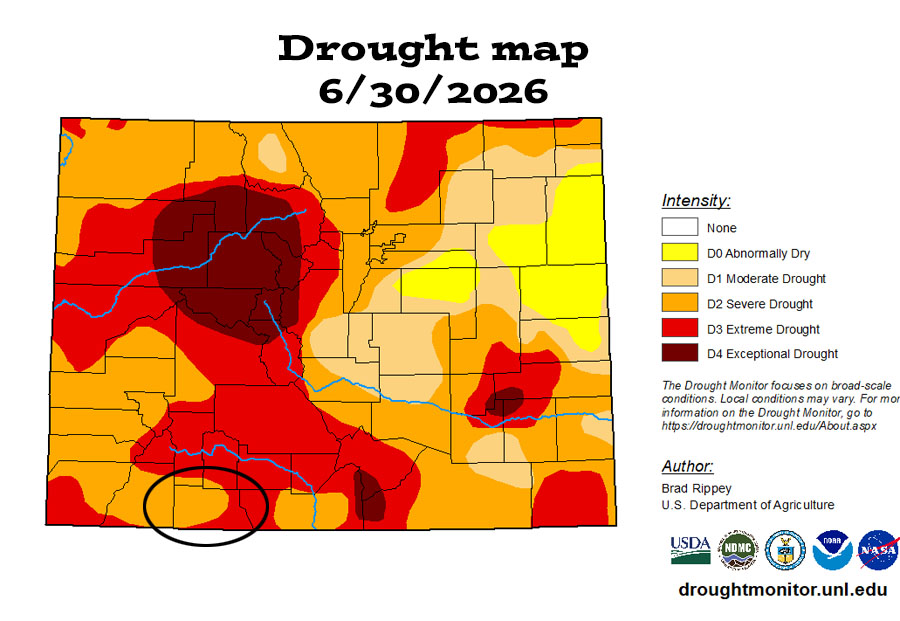
The current drought map shows Archuleta County split between “severe” and “extreme” drought conditions.

The current drought map shows Archuleta County split between “severe” and “extreme” drought conditions.

Friday – 3 Jul 2026 – 3:30pm

June Summary…

The average high for June is 78 and the average low is 36. The record high of 101 occurred on 30 June 1934. The record low of 20 occurred on 2 June 1908. Precip in June averages 0.93″ and the average snowfall is zero. Wolf Creek Pass averages 1.74″ of precip and 1.2″ of snow.

At Stevens Field the highest temp was 89 on 17, 18, and 19 Jun and the lowest temp was 35 on 1 Jun. There was one new record high set on 17 Jun.

There were 20 days with winds at or over 30mph. The highest wind was 44mph on 9 Jun.

How did we do?

June mean temperature anomalies across much of Archuleta County were 3-5 degrees above average.
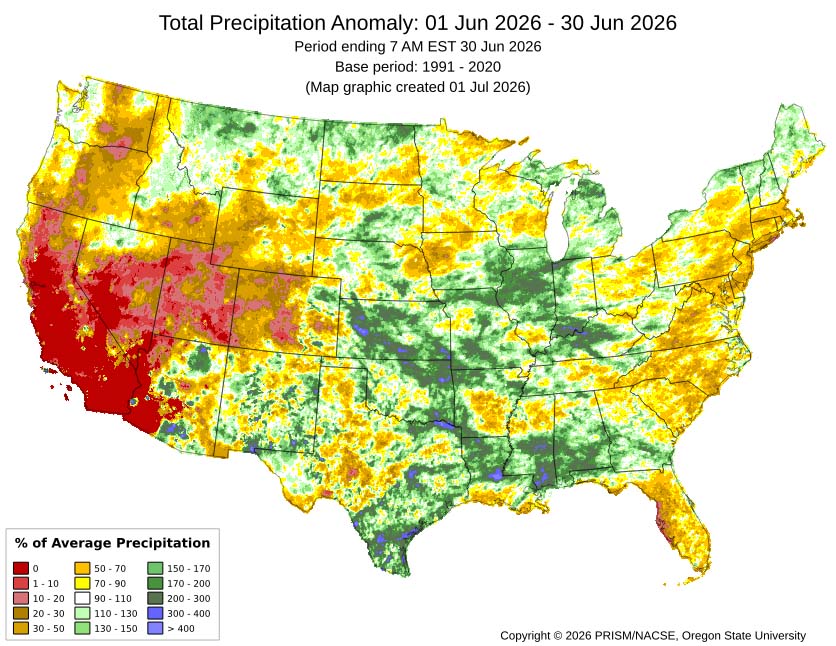
June mean precip anomalies – much of Archuleta County was 30-70% of average.
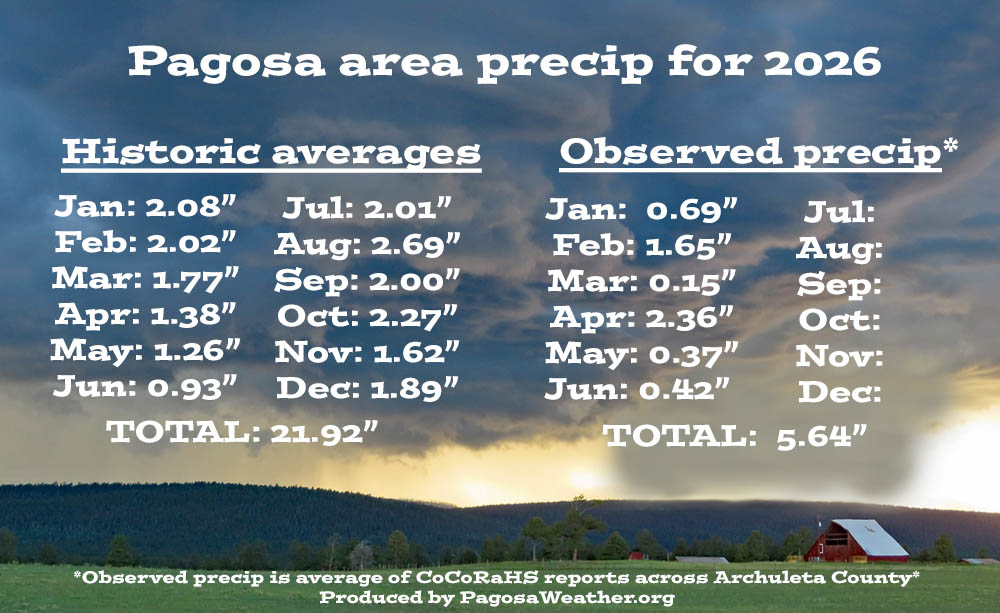
CoCoRaHS precip totals ranged from 0.20″ to 0.97″. Just three locations were at or slightly above the average of 0.93".
CoCoRaHS precip totals ranged from 0.20″ to 0.97″. Just three locations were at or slightly above the average of 0.93″.
Total precip so far in 2026 is 5.64″ – 60% of the average of 9.44″.

Drought and river levels…

Drought conditions remained the same over Archuleta County during June.
The US drought map on the right shows that much of the US is experiencing drought conditions.
Drought conditions remained the same over Archuleta County during June.
The US drought map on the right shows that much of the US is experiencing drought conditions.
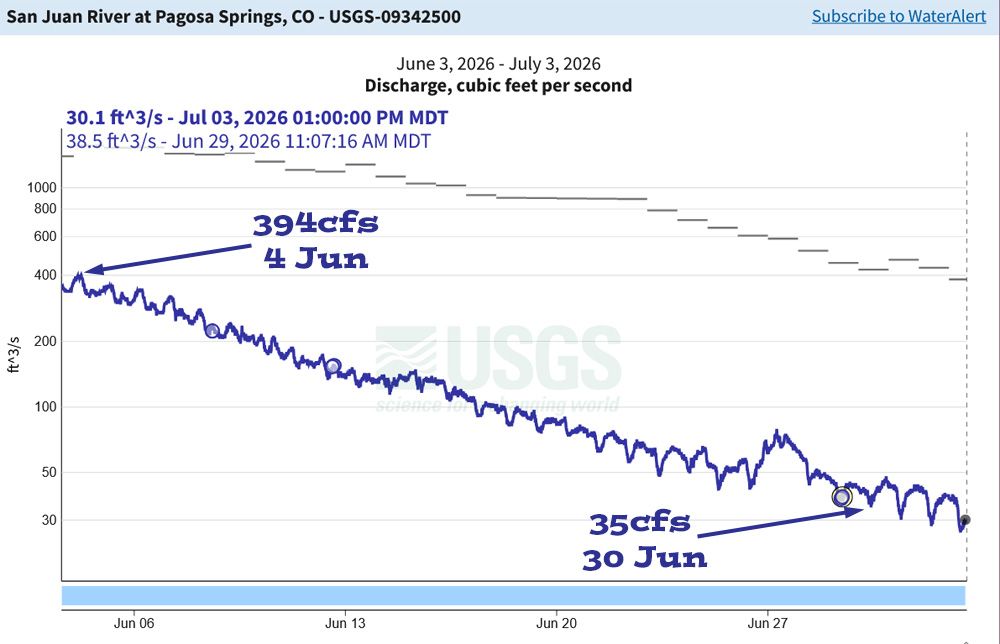
Flow was well below the mean the entire month.
Flow is currently less than 5% of average. Last summer at this time is was similar and then dropped to just 15cfs.

July outlook…

The average high for July is 83 and the average low is 44. The record high of 99 occurred on 7 July 1989. The record low of 24 occurred on 5 July 1912. Precip in July averages 2.01″ and the average snowfall is zero. Wolf Creek Pass averages 3.61″ of precip and zero snow.
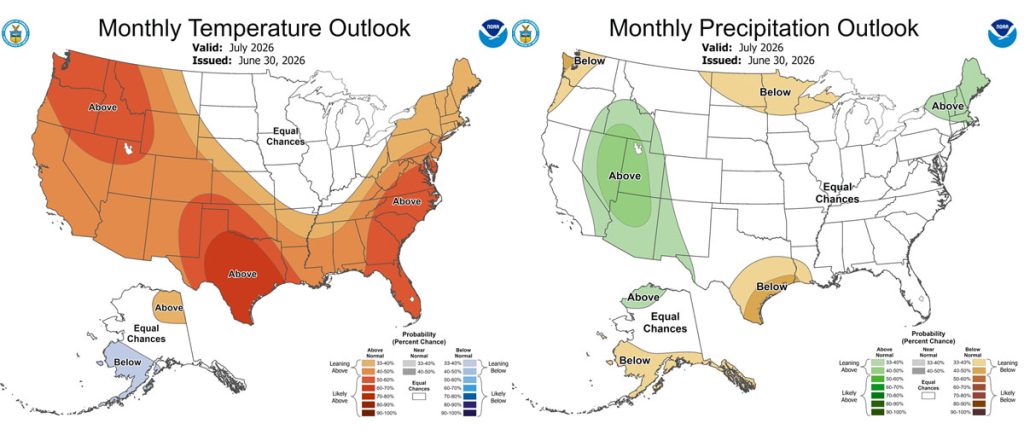
The CPC temp outlook for July on the left shows a 40-50% chance for above average temps.
The precip outlook on the right shows "equal chances" for average precip.
The CPC temp outlook for July on the left shows a 40-50% chance for above average temps.
The precip outlook on the right shows “equal chances” for average precip.
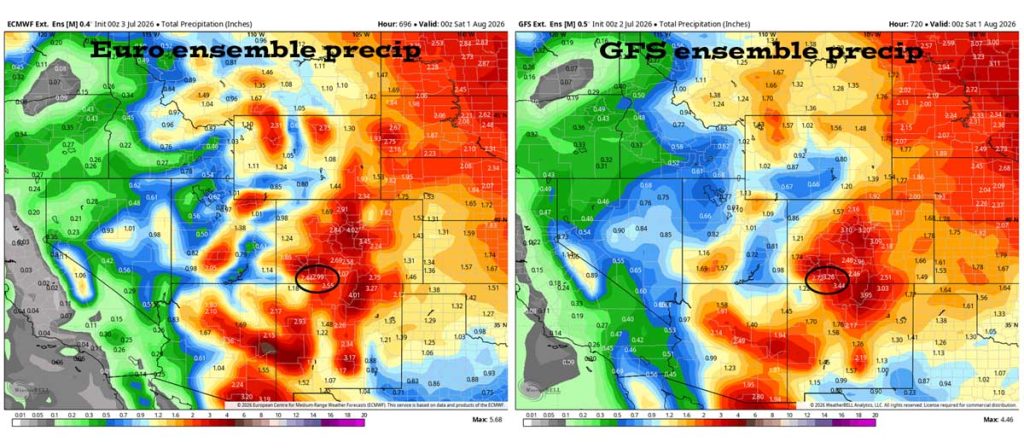
Euro ensemble precip on the left expects 2.99″ for July and the GFS ensemble precip on the right expects 3.26″. Both models expect more than the average of 2.01″.
June verification: The Euro expected 1.78″ and the GFS expected 3.39″. We only got 0.42″ so both models significantly over-forecast precip.
Euro ensemble precip on the left expects 2.99″ for July and the GFS ensemble precip on the right expects 3.26″. Both models expect more than the average of 2.01″.
June verification: The Euro expected 1.78″ and the GFS expected 3.39″. We only got 0.42″ so both models significantly over-forecast precip.
Wild fire potential for July is expected to be above average. Hopefully the monsoon kicks into gear by the middle of month and starts providing some relief.
Wild fire potential for July is expected to be above average. Hopefully the monsoon kicks into gear by the middle of the month and starts providing some relief.

Arleen’s July outlook…

image 1

July begins our wet season with the monsoon. It will make it’s first appearance on the 6th of July. We will be in sputter phase for a good week. Which means more lightning and potential for wildfires than good soaking rains – of course you could get lucky. After that we should see monsoon showers every day. How much of a soaking we will get every day is not clear yet.

The models are waffling in the details as to exactly where the subtropical ridge will set up – to our east, to our west, to our south… each position will impact us a little differently. All models are forecasting above precipitation for the month. That is good news. However, they have been too eager for the last few months.

The El Nino pattern is set up with zone 3.4 already up to 1.2 degrees. MJO will move into our area the second week of July though it is weak. Arctic Oscillation is neutral.

My forecast for the month of July is that we will have near our average precipitation of 2.01”. A few caveats… If the subtropical ridge shifts to the west of the Four Corners area, we will have less than average. The eastern Pacific is open for business as TS Douglas has shown us. If we get the remnants of a tropical system that feeds into the monsoon moisture, we could see above average precipitation. I guess my confidence is not high. Our temps will be just above average.

A HUGE thanks for your precip reports and pictures! Reports help verify our forecasts and make us better forecasters.

Another HUGE thanks to our donors and sponsors! You help cover the cost of this web page and our weather subscriptions, necessary to provide you accurate weather reports!

  • Shawn

Pagosa Weather Blizzard Level Sponsor

Pagosa Weather Storm Sponsor

Picture of Shawn Pro

Shawn Pro

I’ve been a “weather geek” since I was young child. I joined the military out of high school and was lucky to get my dream job in weather. I have 20 years of military weather experience which includes forecasting the weather all over the world. Highlights were six years in Alaska and making life and death weather decisions during deployments. I love mountains, I love snow, and I love summertime thunderstorms. I spend a bunch of time playing outdoors and found my paradise in Pagosa Springs. I do Pagosa Weather as a community service. Hopefully you find us helpful!

2 Responses

Leave a Reply

Your email address will not be published. Required fields are marked *

Pagosa Weather Disclaimer and Release of Liability

This website makes no guarantees about nor bears any responsibility or liability concerning the accuracy or timeliness of the weather information published on this website. All weather information published on this website is for educational and weather enthusiast purposes only. We do not issue Storm Watches, Warnings or Advisories as that ability falls with the National Weather Service, who is the only institution allowed to issue such warnings by law. We are not in any way linked nor affiliated with the National Weather Service, although we do share information and relay weather watches/ warnings, etc. Use of the information on page is at your own risk/discretion, and we are not responsible for any personal/property damages, injury or death associated with weather forecasts, reports or other information as well as communication exchanged in private messages and/or person.

Terms of Use                  Privacy Policy

© 2026 Pagosa Weather 

Website Design by : Brandon