

Pagosa Weather Mascot, Tommy’s favorite season; Winter! Pic taken 23 Feb 2024 (Click on title of post to picture)
Friday, October 11th, 2024 9:00am
We’ve already had the first dusting of snow on the mountain peaks. We know this time of the year the first real snow at Wolf Creek Ski Resort and on down into the Pagosa country valleys is not far behind.
And the biggest question I get starting as early as August is, “What kind of winter are we going to have?” Most of you, like Shawn and I love snow. It is one of the reasons that we live here and we look forward to it along with Tommy!
First, let’s look back and see what kind of winter Pagosa Country had the last few years.
Recap of Winter 2021/2022
Winter started out with an advisory for La Niña, the second winter in a row. In October and November we had just a few systems that left less than average snowfall.
We made up for that in December when 170” of snow fell at Wolf Creek. The snowstorm systems were directly correlated to an intensification of the Madden Julian Oscillation (MJO) in stage 7 offsetting the influence of the La Niña.
However, the La Niña pattern fully kicked in for the rest of the winter keeping all systems to our north. We had a weak arctic outbreak in February, but it was not enough to offset the impact of La Niña.
By April, Pagosa had an average of 83” of snow, just 83% of the historic average of 100.3. At Wolf Creek, the resort closed with 385”, 106% of their 360″ average. The MJO snowstorms over Christmas and New Years saved our winter season.
Recap of Winter 2022/2023
Winter 2022/2023 was the third La Niña winter. It sure didn’t look like it.
The Pagosa Springs area had more then average snow during the winter of 2022/2023. The total for the season was 124.7″ – 24.4″ above the average of 100.3″. Snowfall from October to December was less than average, as expected. Snow really picked up in January for our snowiest month.
At Wolf Creek Ski Resort, it tied with the winter of 2018/2019 for the third most snow at in the last 46 years: 490″ or 136% of average of 360″ average for Wolf Creek Ski Resort. To read more information about that year’s beautiful winter see my winter review article. Winter 2022/2023 Review
Recap of Winter 2023/2024
It was an El Nino Winter and we expected at least average snow. Wolf Creek ski resort had far less than average snowfall. Yet, the Snotel sites tell a different story. What happened?


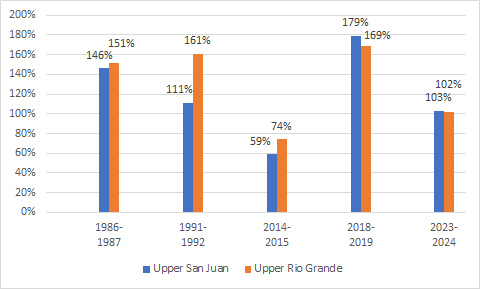
It was a warm winter!
Throughout the winter of ’23/’24 temperatures were about 4 degrees (F) above normal. So the snow that was falling had more moisture per inch than normal. This resulted in below average snowfall at Wolf Creek yet near average water content in the snow pack. Same is true of the snow down in Pagosa Springs. The month of February was a good example. We had above average precipitation across the county with an average of 2.22″ when the average is 2.02″ However, we had below of average snow with average readings of 14.6″ of snow when the average is 18.9″. This was due to the lack of colder air making its way south last winter. The El Nino pattern only really set up for one week in February.
Note: 1. There are inconsistencies in our historical data. 2. The location of our historical data moved around the Pagosa Springs area. Because of our terrain, just moving a mile or two in any direction results in significant differences. 3. We use an average from individual monthly CoCoRaHS totals that include at least 60% of the daily reports. This is not precise but gives us a good idea where we stand. 4. Stevens Field is the official observation point for Pagosa Springs but they do not record precipitation and they certainly do not measure snow.
There are a number of different tools I look at to do a seasonal winter outlook. First, is an old standby.
Farmer’s Almanac Outlook Winter 2024/2025
Last year the historic Farmer’s Almanac had said Pagosa would have a “Cold, Average Snowfall” winter. They were right with the average snowfall but we had above average temperature wise all winter long!
This year, the Farmer’s Almanac is predicting a “Unseasonably Cold, Stormy” winter.
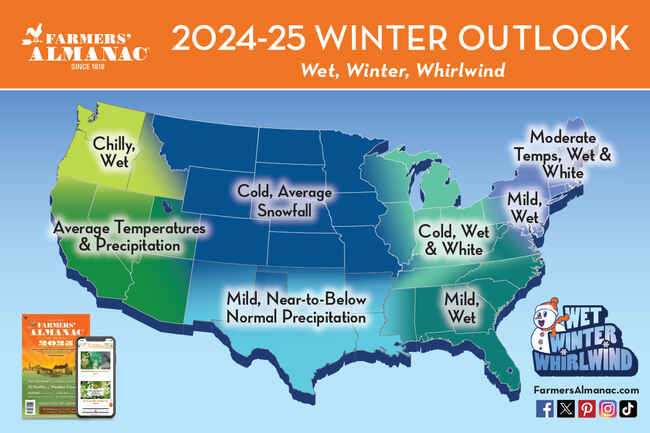
I certainly hope that our temperatures our cold and in turn for every inch of precipitable water we get, we also get nice fluffy snow.
There are a number of models and oscillations I look at to determine our winter seasonal outlook. First, let’s talk about our winter pattern and what gives us cold and stormy weather.
Airmasses
To understand our winter patterns, we need to review some basic earth science.
Always remember, weather happens because the atmosphere wants to be the same temperature and pressure everywhere! It’s always trying to equal out! There are air masses of constant temperature, humidity and pressure that form over homogeneous source regions.
These source regions are large land and oceanic areas around the globe. Due to the rotating earth, centrifugal forces, centripetal forces, and pressure gradient forces, these high pressure airmasses slide around, creating areas of low pressure between them, associated frontal systems and weather along the way as they all try to equalize.
Here in Colorado, we are impacted by the following modified airmasses: Maritime Polar (wet, cool), Continental Polar (dry, cold), Continental Tropical (dry, hot), Maritime Tropical (wet, warm), and Arctic (dry, very cold). Maritime Polar and Maritime tropical colliding with Continental Polar can come together and set up a good snowstorm for us if the systems move at us from the southwest.
What are the controlling factors of these airmasses?

Oceans are much slower to cool or warm than land masses. Over oceanic areas, the way in which systems and air masses circulate is referred to as oscillation. If oceanic areas are their normal temperatures, pressure systems, associated fronts, and air masses move along, so storms give equal consideration to all parts of the country and everyone throughout the Intermountain West sees close to average snowfall totals.
However, differing sea temperatures can throw this schedule off…
El Niño-Southern Oscillation (ENSO)
Most folks have heard of the terms El Niño and La Niña. After a strong El Niño event in 1997-1998, weather folks learned to pay more attention to the El Niño-Southern Oscillation (ENSO) and we have learned how the El Niño and La Niña events can impact our winter snow accumulation. “La Niña is sometimes referred to as the cold phase of ENSO and El Niño as the warm phase of ENSO.”
The ENSO impacts oceanic temperatures near the equator. These temperature changes either suppress or enhance normal storm formations. Amazingly, these impacts at the equator result in changes thousands of miles north and to the normal Polar Front Jet flow as it circles the earth. Areas either see more lows and associated frontal systems or fewer.
If sea temperatures are too warm, an El Niño pattern results and the theory says that the Pagosa area sees more than average snow. However, that can vary wildly. Winter 2018-2019, there was just a weak El Niño and Pagosa Country had near record snowfall. See Picture 4 and the map below.
Note: that the southwest corner of Colorado is in a neutral blank area just north of “wetter”.


If sea temperatures are cooler than normal, a La Niña pattern forms and the Pagosa area sees less than average snow according to the theory. Winter 2017-2018, we were under a La Niña pattern and saw little snow with a paltry 54% snowpack in April. But last year 2022-2023 was a La Nina Pattern and we had 179% snow pack in April. See Picture 6 and map below.


We’ll look at what the ENSO is up to this year after looking at the other oscillations.
The Quasi-Biennial Oscillation
The Quasi-Biennial Oscillation (QBO) is a circulation of winds that occurs in the lower stratosphere above and near the equator. Again, the lowest level of the atmosphere where we live is the troposphere and above that is the tropopause, a thin layer between the two. Above the tropopause is the stratosphere. These lower stratospheric winds can impact the strength of global systems.
The QBO has a cycle of around 28 months. For about 14 months it is out of the east and then it weakens and reverses and flows out of the west for the next 14 months.

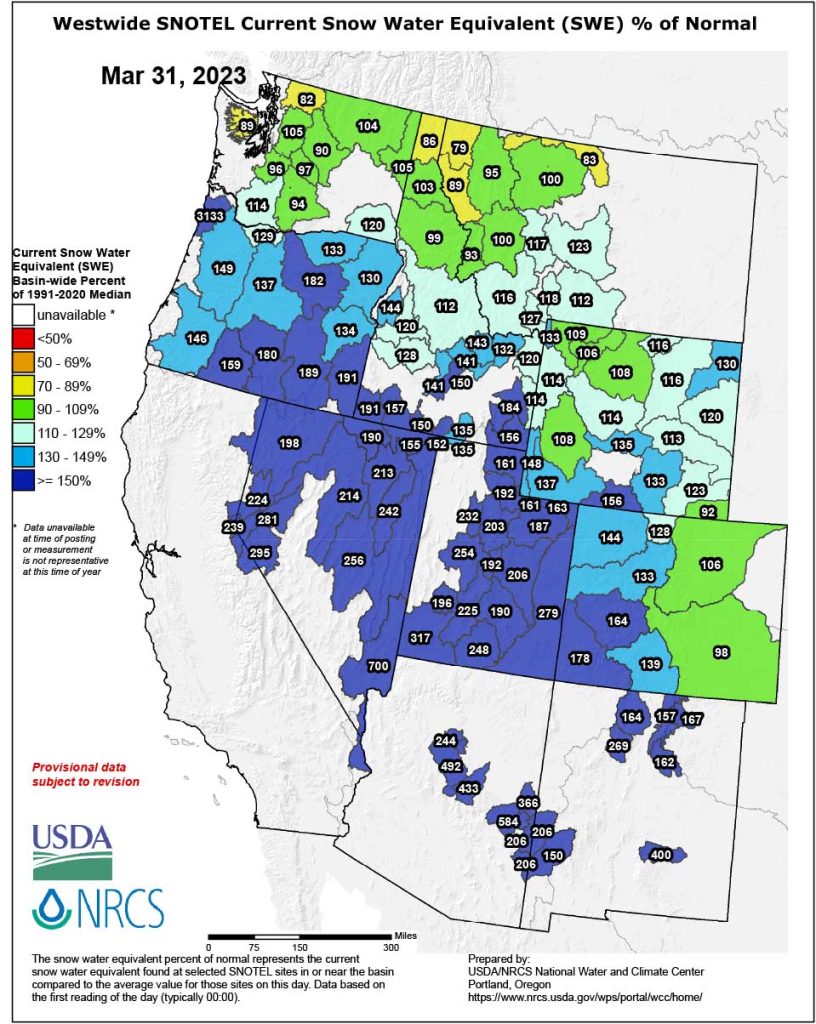
The QBO has been found to have an impact on the oscillations including the ENSO. In fact, if we look back at the winters where we have had a La Niña pattern and a westerly QBO, we had average to above average snow pack between the San Miguel-Dolores-Animas-San Juan and the Upper Rio Grande, the two river drainage areas in southern Colorado. In fact, two yearsago for the winter of 2022-2023, a La Niña winter we had an average snowpack of 158% by the first of March.
Madden-Julian Oscillation (MJO)
Circling the global around the equator is the Madden-Julian Oscillation (MJO). The Madden-Julian can be broken down into eight different stages that continually circulates around the globe. The stages are different areas of suppressed and enhanced areas.
It takes 30-60 days for this pattern to complete a circulation around the globe. This oscillation influences typhoon/hurricane development as well. In addition, it can be weak, or it can be stronger.

Depending on where its areas sit, it can influence the Walker and therefore the systems impacting us. In addition, it can counteract the effect of the ENSO. Or it can magnify the intensity. For example, if a large, enhanced area with a strong MJO were to move over our area during an El Niño winter, we could see some very strong storms that have the potential to drop a lot of snow. Especially, if this all happens with an Arctic Oscillation outbreak!
On the other hand, if an enhanced area with a strong MJO were to move over our area during a La Niña winter, the MJO could negate the impact of the La Niña and allow storm systems to move further south and into our area.
That is exactly what happened in December of 2021. Wolf Creek received 170” of snow in a few weeks time, accounting for 44% of the season’s snowfall.
The Arctic Oscillation
The Arctic Oscillation (AO) is the wobbling of the arctic airmass that forms over the North Pole regions during the winter. Winter of 2020-2021 there were indications of record stratospheric temperatures over the polar regions.
Remember, we live in the Troposphere, where temperatures decrease with height. Above that is a thin dividing layer, the tropopause. Above the tropopause is the Stratosphere region, where temperatures increase with height. Record high temperatures indicated a very compressed and very, very cold arctic airmass.
It can be very difficult to forecast a polar vortex outbreak because that cold air spins like a top before it suddenly sends a bubble of frigid air south. The only thing we can look at is how extensive the snow fields are in Siberia.

The AO wobbled like a top for several weeks in January and February of 2021, before there were several Polar Vortex outbreaks. Surprisingly, it snowed in Spain. Texas had historical cold temperatures. And we had excellent snowfall the third week in February.
Volcanic Eruptions
Volcanic eruptions can inject “huge amounts of volcanic gas, aerosol droplets, and ash”, such as sulphur dioxide into the stratosphere. Once in the stratosphere, they are dispersed by stratospheric winds such as the QBO around the world. Sulfur dioxide converts to sulfuric acid, “which condenses rapidly in the stratosphere to form fine sulfate aerosols. The aerosols increase the reflection of radiation from the Sun back into space, cooling the Earth’s lower atmosphere or troposphere”. This impact can last up to three years depending on the force of the eruption.
In contrast when the underwater Hunga Tonga volcano erupted January 15th, 2022 in the southern Pacific, “sent around 146 teragrams (1 teragram equals a trillion grams) of water vapor into Earth’s stratosphere – equal to 10% of the water already present in that atmospheric layer… The excess water vapor injected by the Tonga volcano could remain in the stratosphere for several years.” Water vapor unlike the aerosols, can cause warming of the earth’s surface since water vapor traps heat. It still is not clear as to how this influenced winter 2022-2023.
So I know a lot of you are thinking, “Ok, Arleen, thanks for the science review. But I really need to know is there going to be enough snow so I can go for a ride with San Juan sled dogs? Or is our drought going to worsen this winter? Or is there going to be so much snow, I should run away to the Caribbean and return in April?”
Let’s take a look at each of these oscillations and see what they are forecast to do this winter. Then determine how they will interact with each other and what the result will be for the winter and snowfall in Pagosa country.
ENSO
Climatologists are forecasting a weak La Nina this winter (Index <1.50C). Sea Surface Temperatures (SST) are below average across the eastern and central Pacific. It is expected to last through the winter.

This depicts the percent chance of an ENSO state. Reading left to right are the months. DFJ is December, January, February.
Using 47 years of data from Wolf Creek Ski Resort, I did a study to determine if the myth of our area having more snow during an El Nino Winter and less snow during a La Nina winter is true. The results are very fascinating…
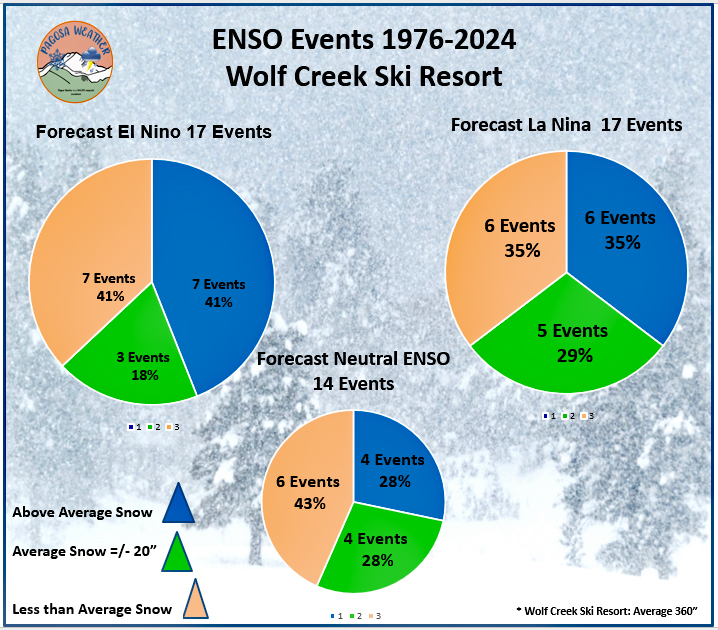
In the last 47 years, we have had 17 La Nina events. During six of those events we had above average snow or more than 380″ of snow. But during another six of those events we had less than 340″ of snow at Wolf Creek Ski Resort. Note: Wolf Creek Ski Resort snow does not take into account early snows of spring storms after the resort closes so this average number is much lower than the numbers kept for years at Wolf Creek Pass.
The main impact of either a cold or warm ENSO event is that the pattern gets STUCK. The undulating polar front jet does not advance to the east as it normally does. Areas receiving little snow continue to be dry. Other areas getting slammed with snow continue to be inundated with storms.
I have found that it is important to look at other global oscillations and get clues as to how these players will interact with each other. They can enhance or negate the impact of the ENSO…
QBO
The QBO switched from the easterly flow to westerly flow in June of 2023. It is just starting to strengthen now and should remain strong throughout the winter months.

There does appear to be a correlation between a La Nina pattern and westerly winds for average to above average snow for Wolf Creek Ski Resort. Using Snotel data, there has been eight winters that were La Nina events with westerly QBO winds since Snotel data has been tracked. Three of those winters were above average including winter 2022/2023 when the Upper San Juan recorded 186% of average snowpack. The other five winters were near average.

MJO
The MJO has been weak over the last few weeks. It is forecast (green line) to continue to be weak for the next two weeks.. Zones 7 and 8 are enhanced areas for us.
Beyond that it is hard to say. On average is takes the MJO 30 to 60 days to encircle the globe. If it keeps with that schedule, it should visit us again in the middle of December just in time to build a good base at Wolf Creek for Christmas. That is if it strengths and and stays on a true path.
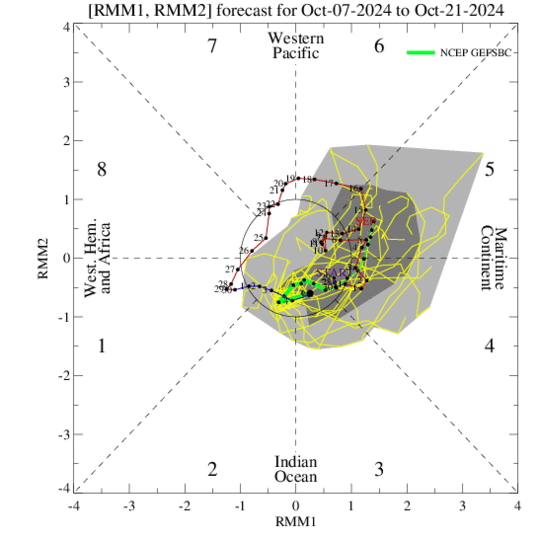
MJO Forecast: Red & Purple line indicate strength & location over last few weeks. Green line is forecast strength & location over next few weeks. Yellow lines are the different ensemble model solutions. There is a lot of variability.
AO
The Arctic Oscillation (AO) is currently negative and is predicted to become positive over the next two weeks. A positive AO to start will help build/block cold air for stronger outbreaks later in the winter. It will probably be difficult to forecast the extent/strength of the AO till we get into December. Arctic sea ice extent is just starting to grow but slowly for now.

In the past a La Nina Winter has resulted in a strong arctic outbreak. The winter ’21/’22 is a good example when there was a stratospheric warming event (lower atmosphere is very cold during such event). If we are going to see such an event it is normally in January or February.
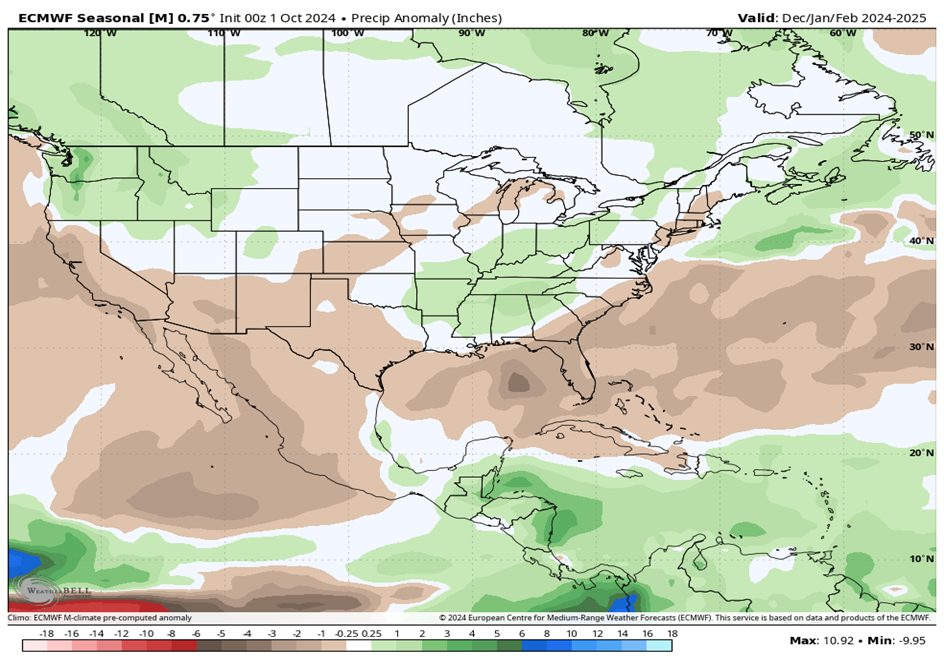
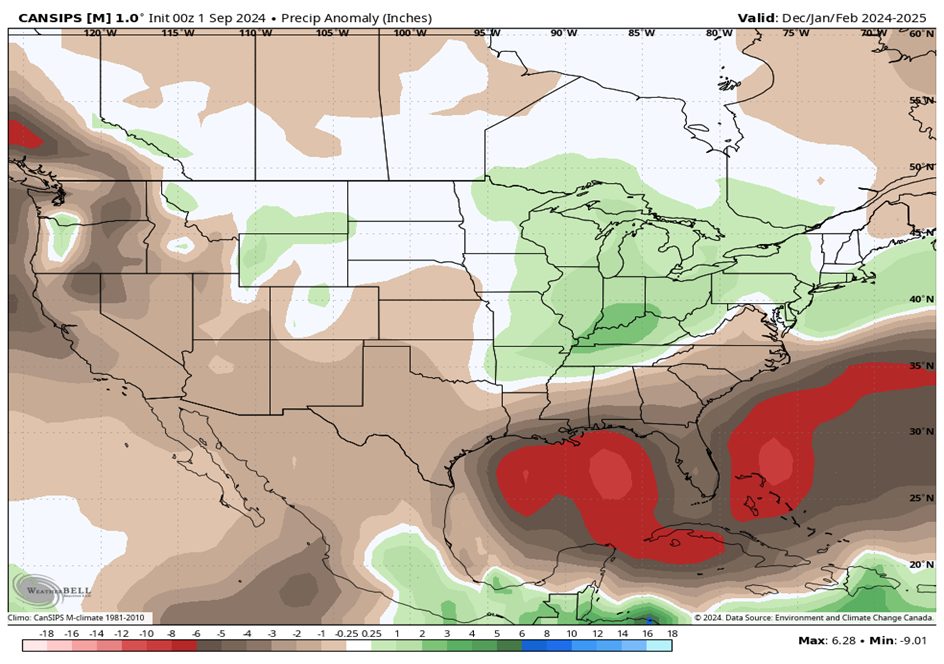
Long Range Model Forecasts
CPC (Climate Prediction Center) Outlook
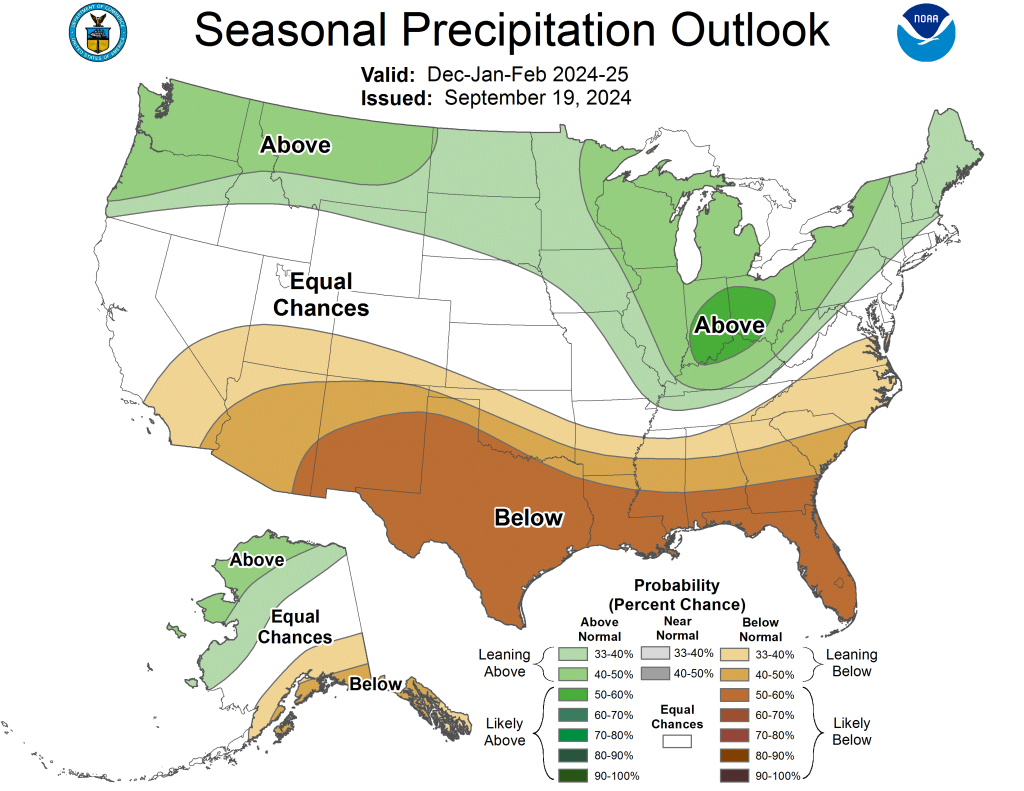
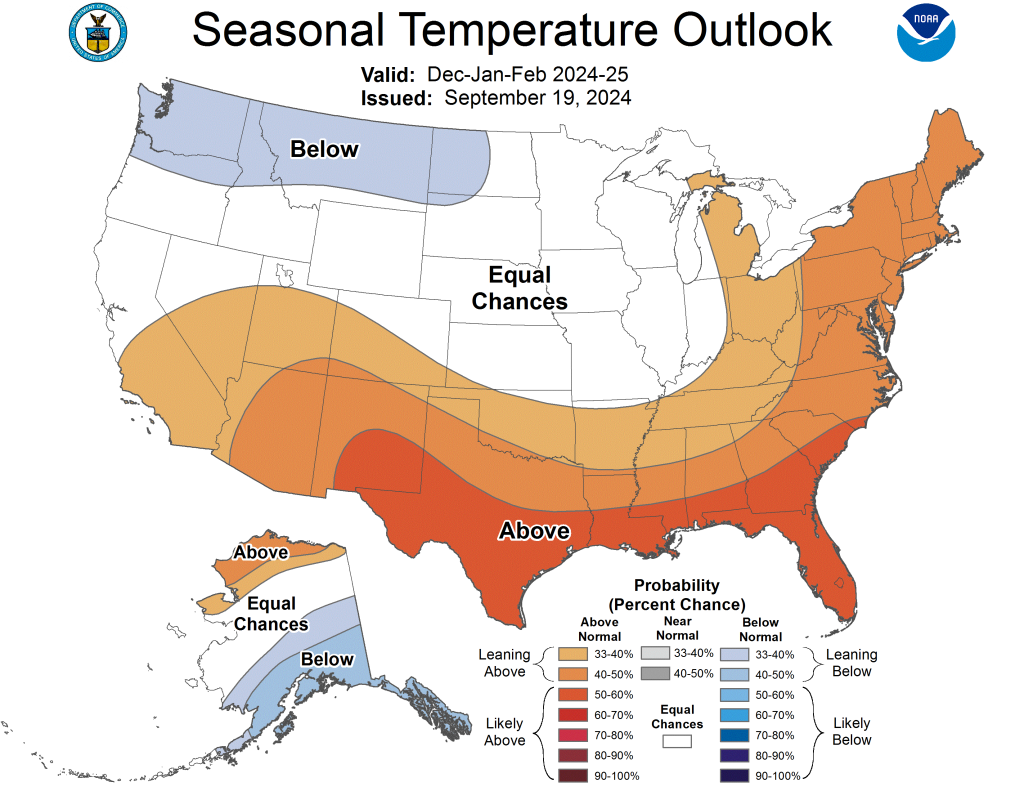
The CPC outlook is very much following the lines of a typical La Nina pattern.
Climate Forecast System
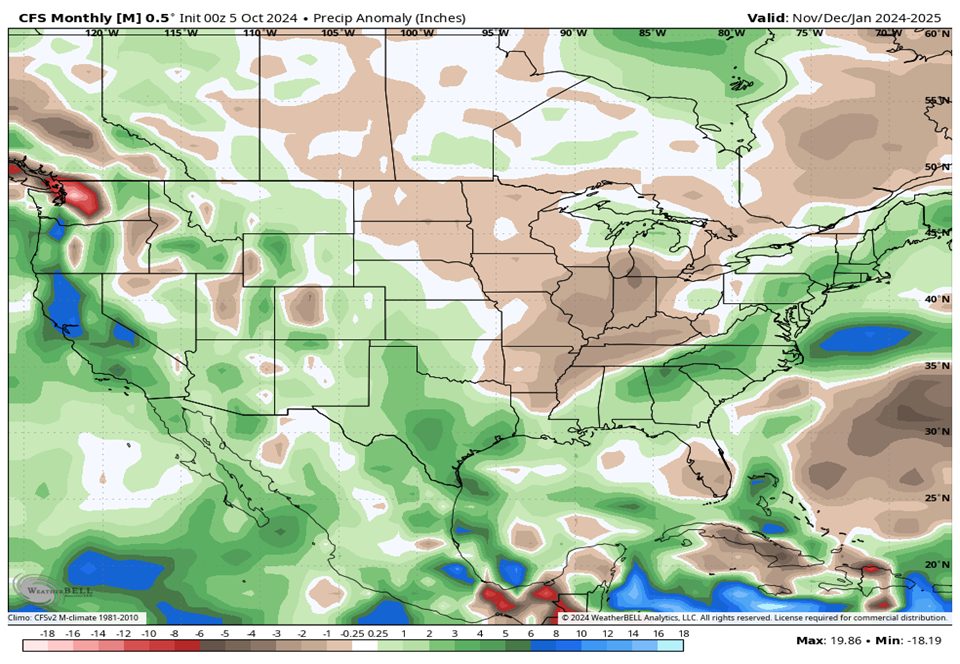
EURO
Canadian
Pagosa Weather Winter Outlook for Snow for 2024/2025
Based on the information we have at this time, Pagosa Weather winter outlook for Pagosa and Wolf Creek is that we will have above average snow for December into February with average snow in November and March. This is based on the correlation of a weak La Nina with westerly QBO winds. There is a good chance we will see an MJO event in December. In addition there is the possibility of an Arctic influenced event in January and February.
The Pagosa Weather winter outlook is that we’ll have above AVERAGE snowfall for Winter 2024/2025.
Pagosa Weather will continue to follow the oscillations and update you as more information becomes available.
Remember, it is not too early to get the snow dances going! Take a quick look at This is Pagosa to remember how to do your snow dances: This is Pagosa Snow Dance
Some articles for further reading and fun learning:
ENSO: ENSO: Recent Evolution, Current Status and Predictions
ENSO Blog: ENSO Blog
Severe Weather Europe: Winter 2024/2025 snowfall predictions
Madden-Julian Oscillation: What is the MJO & Why do we care and No butterflies, just tropical rainfall
Current MJO: Recent Evolution, Current Status and Predictions
Arctic Oscillation: Arctic Oscillation/Polar Vortex blog
QBO: Impacts, processes and projections of the quasi-biennial oscillation
Volcanos: USGS
Nasa article on Tonga Eruption
OPEN Snow: 2024-2025 Colorado Winter Outlook
– Arleen


6 Responses
I read your report. Sounds like good news.
Ros – yes! You should have had pleasant dreams!
OMG…that is a (snow) mountain of info…I just skimmed, but will come back & read when I have time to digest…lol
Michele! Snow mountain of info!
Thank you, Jeff! Time for El Niño to begin his work. ❄️❄️❄️
All I can say is WOW!! That is a ton of information!! Let’s keep our fingers crossed that we get above average snowfall this winter!!